Abstract
Recent developments in process-based coastal area models such as XBeach provide new opportunities to predict coastal responses to primary forcing mechanisms such as storm hydrodynamic by using 2DH grids. However, due to the lack of measured data, there are few application scenarios of the models. Therefore, more measurement and research are needed. In this paper, the Typhoon Lekima that hitting Zhejiang Province during neap tide period was selected to simulate morphodynamic responses of the Huangcheng Beach by assuming encountering with different tide types. Cross shore measurements with eight cross-shore profiles (named S1 ~ S8 from north to south) of the Huangcheng Beach pre- and post- the Typhoon Lekima respectively were presented. Then a 2DH storm surge and wave coupled model was established with Delft3D Flow/Wave. The model was well calibrated with measured water levels and wave data and provided hydrodynamic boundary conditions of different typhoon and tide types coupling situations for a refined model. The refined model was built using XBeach and simulated the morphological responses of the Huangcheng beach with well verifications. On basis of the numerical results, bed level changes at the eight profiles were analyzed, and the character of erosion and deposition under different tide conditions were illustrated. The net sand volume changes were got smaller under the spring tide condition rather than middle tide and neap tide conditions. Further study of the distribution of wave induced current at different stages of collision, inundation and ebb shown that the stronger current under spring tide condition would increase the sediment transport rate and reduce the deposition volume at profiles S3 and S6 ~ S8, and the total amount of sediment involved in transportation had increased for the whole beach, leading to the reduction of net erosion volume at profiles S1, S2, S4 and S5.
Introduction
Beaches provide important places for human interaction with the ocean, and affect the coastal human society and marine ecological environment. Along the East China coasts, natural embayed beaches are widely distributed and frequently influenced by storms and typhoon waves, causing severe coastal erosion, wave overtopping, inundation and instability of beach systems, and leading to devastating consequences (Bernabeu et al. 2003; Shimozono et al. 2020; Aránguiz et al. 2020; Tong et al. 2014). Meanwhile, the morphology of a beach is mainly controlled by wave, tide and sediment characteristics at various time scales (Van Rijn et al. 2003). Major high tide and wave events generated by typhoons impose huge morphodynamic stresses on beaches over short time scales. Hence bed erosion triggered by storms can be significantly higher than that of the long-term beach recession under normal conditions. And due to the uncertainty formation date of typhoons and coupling situations with tide types during landing period, the characters of bed level changes of beaches will be quite different (Cai et al. 2004). With the large tidal range along the Zhejiang coast, the tide can submerge the berm of beaches during spring tide, while just reach the foot of beaches during neap tide (Huang et al. 2016). So, it is important to simulate and predict the morphodynamic responses of these embayed beaches to the typhoons encountering with different tidal types.
This study attempts to explore the morphological response of natural embayed beach to Typhoon Lekima, taking the Huangcheng Beach, a natural embayed beach located in the northeast of Shipu Town, Zhejiang Province as an example. Cross-shore bathymetrical measurements were investigated before and after the Typhoon Lekima, one of the strongest typhoons landing along the China coast. A hydrodynamic numerical model based on Delft3D Flow/Wave was developed and validated by observation data, and a morphologic model was built with XBeach to hindcast morphological responses of the beach. The simulation of XBeach was compared with field measurements, and finally the erosion and deposition of the beach under different tide types encountering situations were analyzed.
Study area
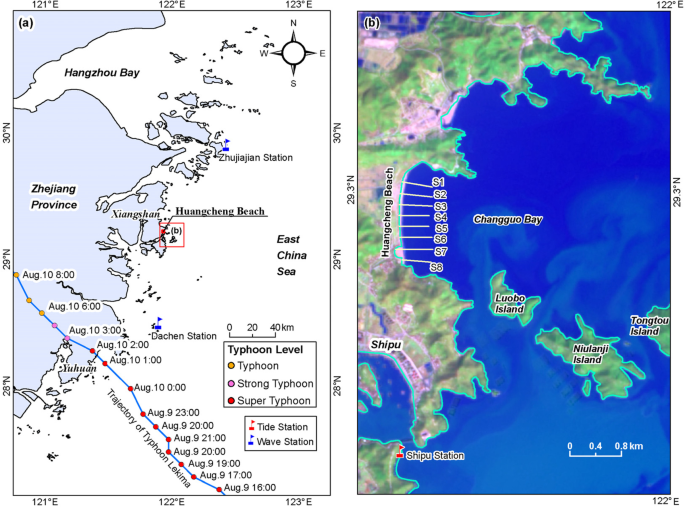
Located in the northeast of Shipu Town, Xiangshan County, Zhejiang Province, the Huangcheng Beach is embayed in Changguo Bay with the beach pace scales of 1800 m in north–south direction and 300 m in east–west direction. Two headlands extending offshore on north and south side of the beach and islands such as Luobo Island, Niulanji Island, Tongtou Island et al. locate on southeast of Changguo Bay. The beach slope along the coast is between 2.8 ~ 3.1% with the elevation range from -3.0 m to 4.0 m, and the sediment median grain size (D50) of the beach surface is 0.18 ~ 0.20 mm. The tide type around the Changguo Bay is a regular semidiurnal tide with mean high spring tide level of 2.39 m and mean low spring tide level of -1.70 m, and the average velocities during flood and ebb tide are generally less than 0.6 m/s (Tong et al. 2015; Huang et al. 2016). Since a seawall was built at the back of the beach in 2000 and the balance of cross-shore sand supply was broken, sand erosion occurred continuously in the northern area of the beach in recent years (Tong et al. 2014, 2015).
Typhoon Lekima formed in the Northwestern Pacific on 4 August 2019, moved northwestward and developed into a super typhoon on 7 August, landed in Wenling City, Zhejiang Province at 01:45 UTC + 8 10 August, subsequently moved northward and began to weaken continuously as shown in Fig. 1(a). The lowest sea level pressure of Lekima was 925 hPa and the highest 10-m maximum wind speed was 54 m/s according to the best-track data of Japan Meteorological Agency (Zheng et al. 2019).
In order to investigate the morphological responses of the Huangcheng Beach under the impact of Typhoon Lekima, bathymetries at eight profiles named as S1 ~ S8 from north to south were measured separately on 5 July and 15 August in 2019 as shown in Fig. 1(b). Topography of the eight profiles were measured at low tide using the RTK (Real Time Kinematic) technology with an error margin of 2 cm and were all corrected to elevation datum of the National Vertical Datum 1985 (named NVD 1985 thereafter). Tide processes at Shipu Station as shown in Fig. 1(b) and wave processes at Zhujiajian Station and Dachen Station as shown in Fig. 1(a) during this typhoon event were collected since there is no wave observation station near the Huangcheng Beach.
Numerical models
Model description
A two-dimensional horizontal (2DH) depth-averaged hydrodynamic numerical model including storm tide and wave was developed based on Delft3D Flow/Wave to simulate the storm tide and wave processes during Typhoon Lekima around Changguo Bay. Then a detailed morphodynamic model was established with XBeach to simulate short-term morphodynamic response of the Huangcheng Beach. The XBeach model was fed at the boundaries by wave and water level conditions which were generated by the Delft3D Flow/Wave model, meaning that the two models were nested.
Delft3D is a numerical model based on the finite difference method. The Delft3D Flow module uses the Alternating Direction Implicit method (ADI method) to solute shallow water equations, and the extended ADI method and a central difference are applied for the horizontal and vertical convective terms respectively. The Delft3D Wave module is based on SWAN model which is based on the discrete spectral action balance equation and is fully spectral (in all directions and frequencies). Detailed descriptions of Delft3D Flow/Wave can be referred to in the documents (Lesser et al. 2004; Booij et al. 1999).
Delft3D can model morphodynamic evolution and some studies on the morphodynamic modeling in the Zhejiang coasts has been made (Xie et al. 2009, 2013, 2017), while it performs not very well under storm conditions. The depth-averaged model XBeach was developed specifically to predict the 2DH storm-driven hydrodynamics and morphological evolution of beach profiles (Karunarathna et al. 2014, 2018). The model has been fully validated by simulating hydrodynamic processes such as wave propagation and transformation with small errors and has a morphodynamic component that enables reproduction of known forms of morphological storm response under a variety of geometric and hydrodynamic conditions (Karunarathna et al. 2014; Vries, B. D. 2011), and widely used to the beach morphodynamics studies (Roelvink et al. 2009; Vries, B. D. 2011; Karunarathna et al. 2014, 2018; Nederhoff 2015; Dissanayake, P. et al., 2015; Harter and Figlus, 2017).
XBeach is a nearshore numerical model developed for simulating the natural coastal response of sandy beach during storm and typhoon conditions including routines for long wave propagation, short-wave envelope propagation, non-cohesive sediment transport and bed update. The model includes a time-dependent wave action balance solver, eliminating the need for a separate wave model and allowing different wave groups to travel in different directions (Roelvink et al. 2009; Nederhoff 2015; Harter and Figlus 2017). More introduction of XBeach model can be referred to (Roelvink et al. 2009).
Model setup
Model grid
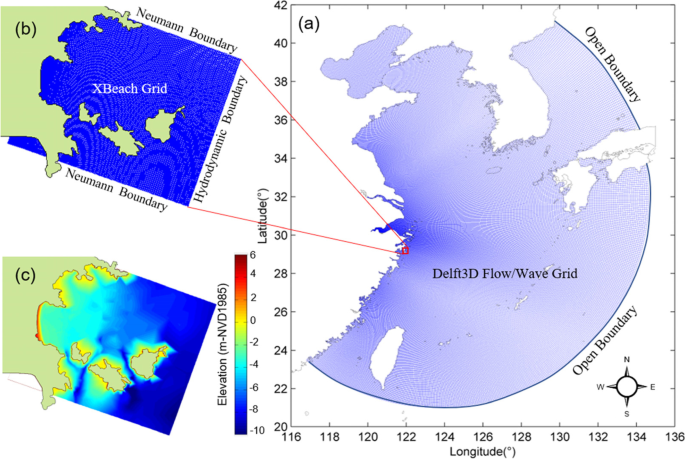
The model grids of Delft3D Flow/Wave and XBeach are shown in Fig. 2. The lager domain which covering the whole East China Sea from 117°E to 135°E and 21°N to 42°N is the Delft3D Flow/Wave grid hereafter known as DG as shown in Fig. 2(a). The smaller XBeach grid shown in Fig. 2(b) hereafter known as XG included the northeast of Shipu Town and its surrounding sea area, and is sufficiently large enough to minimize the influence of boundary conditions.
Curvilinear grid generated by Delft3D-RGFGRID (WL Delft 2018) are used on both domains of DG and XG. There are 537 × 308 grid cells in the DG where the smallest grid sizes are 300 m × 500 m near Shipu Town and the biggest grid sizes are 9 km × 10 km at the open boundary. There are total 200 × 300 grid cells in the XG, with the smallest space scale of 10 m on the beach area. The dimensions of the XG in west–east and north–south directions are about 7.0 km and 5.7 km, respectively, and the whole study area is about 40.0 km2. The elevation of bed levels at the hydrodynamic boundary of XBeach model are about -8.7 m ~ -9.9 m as shown in Fig. 2(c).
Parameters and boundary conditions
In Delft3D Flow model, the simulation time step was set as 30 s corresponding to a Courant number less than 10. The Chezy coefficient of 50 ~ 70 m0.5/s with spatial variation related to water depth and seabed roughness were adopted. The open boundaries on the east and south side of the DG grid were determined by hydrostatic pressure drop. Astronomical tide levels were provided by the global tide model TPXO6 (Egbert et al. 2002). In Delft3D Wave model, the bottom friction coefficient of JONSWAP was set to 0.067 m2s−3 (Hasselmann et al. 1973), the depth induced wave breaking parameter was set as 0.78. Wind and pressure field data during Typhoon Lekima was derived from ECMWF (known as the European Centre for Medium-Range Weather Forecasts). The wave-current interaction was implemented between Delft3D Flow and Wave model by communicating water level, current velocity and wave characteristics (WL Delft 2017). The simulation time was from 7 to 11 August, 2019.
In the XBeach model the Chezy coefficient was set to 50 m0.5/s and sediment diameter (D50) was set to 0.2 mm to calculate bed friction. The computational time step of the model was controlled by Courant-Friedrichs-Lewy (CFL) number with 0.9. The hydrodynamic boundary condition of XG containing water levels and wave processes were fed by the DG. The Neumann boundary was used in the right and left side of the hydrodynamic boundary, meaning that there was locally no change in surface elevation and velocity but also other possibilities implemented into XBeach. Other parameters were set as default according to (Roelvink et al. 2009). The simulation time ranges were the same as Delft3D Flow/Wave model.
Model verification
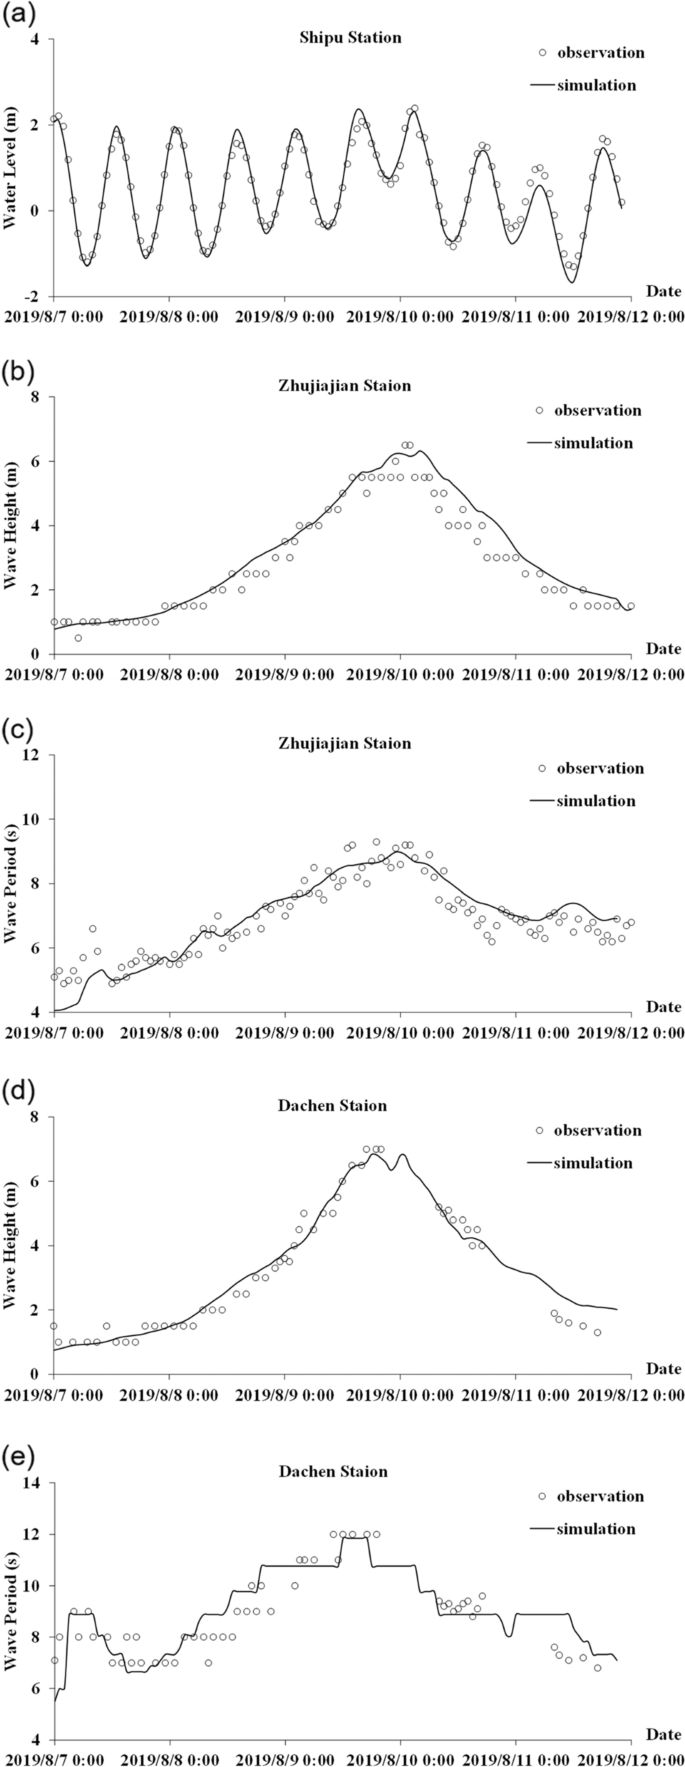
Delft3D Flow and Wave model were verified by observation data of water levels on Shipu Station, significant wave height and wave period on Zhujiajian Station and Dachen Station during Typhoon Lekima. The results are showing in Fig. 3. It can be seen that the tide level and wave process simulated are in good agreement with the measured values. The highest tide level and wave height during typhoon period can be hindcasted reasonably.
In this paper, the Nash–Sutcliffe Efficiency (known as NSE) coefficient defined by (Moriasi et al. 2007) was applied to evaluate the model quality. The formula is given by:
where YobsiYiobs is the observed data, YsimiYisim is the simulated data, YmeanYmean is the mean value of the observed data, and n is the total number of observed values. According to (Motovilov et al. 1999), the predictive efficiency of model is categorized as good for NSE > 0.75, satisfactory for NSE = 0.36 ~ 0.75 and unsatisfactory for NSE < 0.36.
The NSE values of simulation water levels on Shipu Station is 0.96, the significant wave height and wave period on Zhujiajian Station are 0.91 and 0.82, and on Dachen Station are 0.98 and 0.97. All the predictive efficiency of models is categorized as good, indicating that the Delft3D Flow/Wave model can simulate the hydrodynamic processes around Changguo Bay effectively and can provide reasonable hydrodynamic boundary conditions for XBeach.
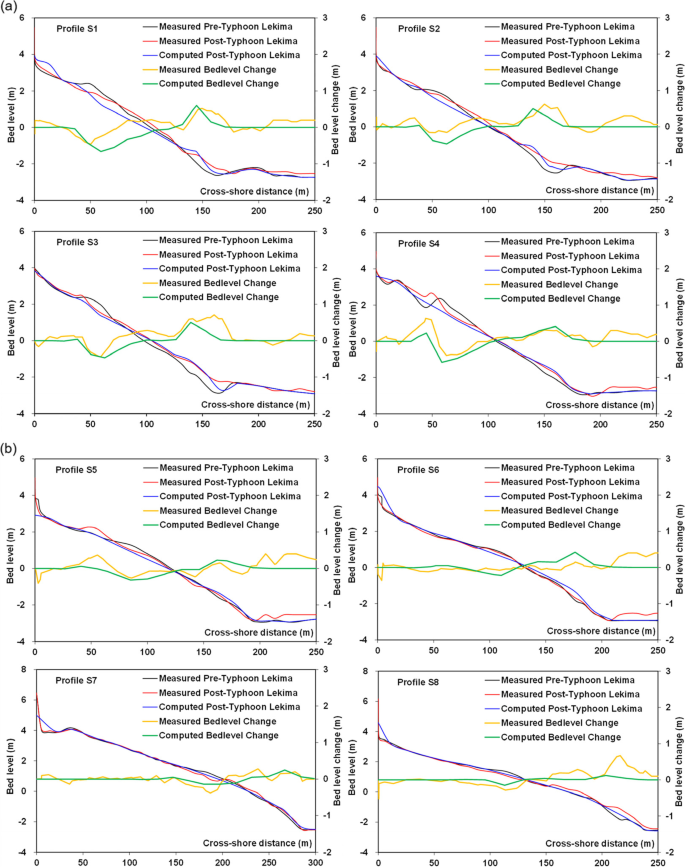
Measured data on 5 July and 15 August in 2019 was used to verify the XBeach model. Predicted bed levels and bed level changes of the eight profiles pre- and post- Typhoon Lekima compared with the measured data were shown in Fig. 4. Significant bed level changes occurred at profiles of S1 ~ S4. Good agreements of sediment transport trend between the observed and simulated bed levels were obtained especially at profiles of S2 ~ S4. Both measured and simulated topographic changes at profiles of S5 ~ S8 were relatively small and it was hard to say whether the verification was good or not. Significant deposition near the foot of the beach (200 ~ 250 m offshore) after the storm occurred especially at profiles of S1, S2, S4, S5 and S6 based on the measured data, which were absent in the predicted results. It might be caused by sudden siltation of the muddy tidal flat by storm. Besides, the variation of beach bed levels might be caused by sustained low intensity hydrodynamic during 5 July to 6 August and 12 August to 15 August that did not included in the simulation time of XBeach model.
The performance of XBeach model was evaluated by the Brier Skill Score (known as BSS) defined by (Van Rijn et al. 2003). The formula is given by:
where zb,c is the computed bed level, zb,m is the measured bed level, Δzb,m is the error of measured bed level, zb,0 is the initial bed level, ⟨..⟩⟨..⟩ is averaging procedure over time series. The predictive qualification of model is categorized as excellent for BSS in the range of 0.8–1.0, good in the range of 0.6–0.8, reasonable in the range of 0.3–0.6, poor in the range of 0–0.3 and bad in less than 0.
The qualification of eight profiles from S1 to S8 were 0.37 (reasonable), 0.65 (good), 0.83 (good), 0.61 (good), 0.36 (reasonable), 0.33 (reasonable), 0.46 (reasonable), 0.32 (reasonable). It could be concluded that the model produced good results for morphological responses under the influence of Typhoon Lekima.
Simulation of encountering conditions
Due to the uncertainty formation date of typhoons and coupling situations with tide types during landing period, characters of bed level changes of beaches will be quite different. The tide can submerge the berm of beaches during spring tide, while just reach the foot of beaches during neap tide especially in some areas of Zhejiang Province. And it was just neap tide when the Typhoon Lekima landed in Wenling, Zhejiang Province at 01:45 UTC + 8 10 August. So, in this paper, different conditions were assumed to simulate and predict the morphodynamic responses of the Huangcheng Beach to the typhoons encountering with middle tide on 12 August, 2019 and spring tide on 15 August, 2019. The open boundary conditions of the Delft3D Flow/Wave model were adjusted with the wind and pressure field unchanged to make the Typhoon Lekima just landing at middle tide and spring tide. The highest water levels and wave height during typhoon period under different tide types at the hydrodynamic boundary of XBeach model were shown in Table 1.
Results and discussion
Simulation results of the eight profiles when the Typhoon Lekima encountering neap tide (actual condition), middle tide (assumed condition) and spring tide (assumed condition) were shown in Fig. 5. At profiles S1 ~ S4, bed level changed similarly from -1.5 m to + 1.5 m (cross-shore distance of 50 m ~ 150 m) under different conditions. But more erosion occurred at the top of the beach from + 1.5 m to + 4.0 m (cross-shore distance of 0 m ~ 50 m), and more deposition occurred at toe of the beach from -2.5 m to -1.5 m (cross-shore distance of 150 m ~ 180 m) under middle tide and spring tide conditions. It meant that a higher water level and tide range could affect the sand at higher positions and move the sand offshore further. Take profile S1 as an example, the influence range of tide and wave could reach to + 2.5 m under middle tide condition, while + 3.8 m under spring tide condition. Thus, the bed level changes below + 2.5 m between middle tide and spring tide conditions were similar, and the sand above + 2.5 m could only be transported under spring tide condition. As the bed level changes at profiles of S5 ~ S8 were relatively small, there were little differences among there profiles under different tide types.
The net sand changes (NSC) of the profiles were related to the longshore sediment transport and could be calculated by:
where n is the number of bed level points at the profile, Zib,0Zb,0i is the initial bed level, Zib,sZb,si is the bed level after storm, ΔdΔd is the distance between the two adjacent measuring points.
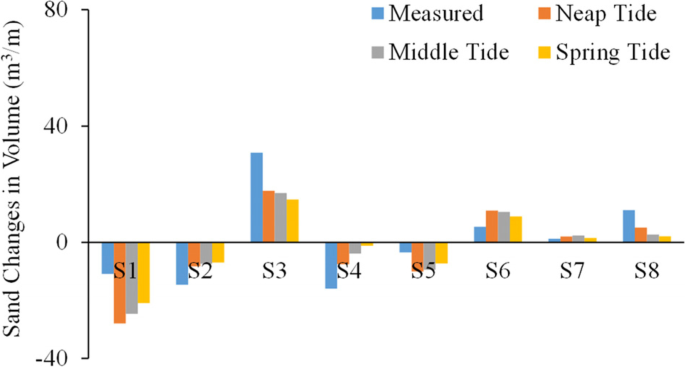
Simulated net sand changes at the eight profiles under different conditions were shown in Fig. 6. The observed and simulated sand volume changes of the five profiles were basically consistent. Sand volume decreased in profiles S1, S2, S4 and S5, while increased in profiles S3, S6, and S8. Profile S7 tended to be stable with the net sand volume changes of about 2.0 m3/m. Although the erosion and deposition values were larger under the spring tide condition rather than middle tide and neap tide conditions, the net sand volume changes got smaller. For example, the simulated net volume changes under neap tide and spring tide condition were -28 m3/m and -21 m3/m at profile S1, while 17.7 m3/m and 14.7 m3/m at profile S3. Same volume change patterns also occurred at other profiles. So, it is necessary to analyze the wave induced current fields which dominating the sediment transportation of the beach.
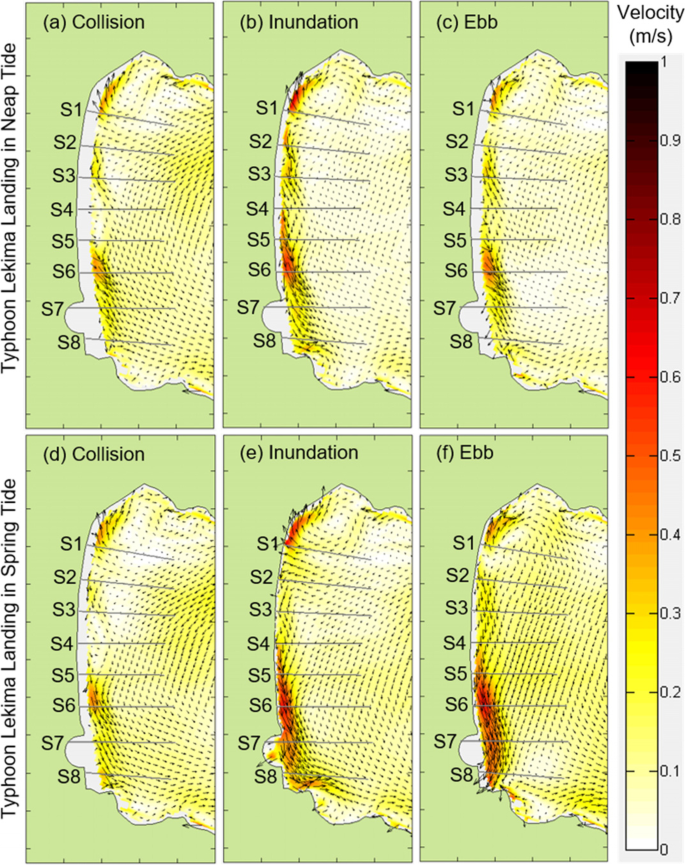
As there is no obvious beach crest on the Huangcheng Beach, the impact of storm and wave can be divided into regimes as collision, inundation and ebb (Asbury 2000; Harter et al. 2017). The simulation of spring tide and neap tide conditions were compared with the distribution of wave induced current at different stages of collision, inundation and ebb (shown in Fig. 7). Under the neap tide condition, the current field distributions were similar at different stages, but the velocities were lager at inundation stage. Longshore current occurred on the north side of profile S1, areas between S2 to S8, with onshore current channel between S1 and S2. Local circulations of current formed on the north side of profile S1. The longshore current between S3 to S5 was week at the stage of collision. The spring tide condition simulation results showed the same trend as the neap tide condition. But at the stages of inundation and ebb, tide current could reach the top of the beach, and velocities at profiles S5 to S8 were lager. Stronger wave induced current would increase the sediment transport rate and reduce the deposition volume at profiles S3 and S6 ~ S8. As storm tide and wave could influence the sand on top of the beach under spring tide condition, the total amount of sediment involved in transportation had increased for the whole beach, leading to the reduction of net erosion volume at profiles S1, S2, S4 and S5.
Since the 1980s, with the rapid development of economy and society in coastal areas, human activities are affecting the natural state of coastal beaches with unprecedented intensity and breadth. Many beaches have been destroyed by artificial sand excavation and gradually disappeared. After 2010, with the attention paid to ocean ecology and environment in coastal areas, there are more beach protection and nourishment projects, and many beaches have been restored. More and more attention has been paid to the study of beach morphodynamic evolution and protection. Otvos (2004) compared the response of the same beach to two storms and found that in several locations of continental beaches, weaker storms caused less damage, and even silted beaches in different locations in the same area. While the typhoons attacking Zhejiang coast were usually very strong and usually caused erosion on the beaches, which was quite different from the role of the weaker storms in Otvos (2004). On the other hand, it is possible that weak storm can also cause silted beaches. Cai et al. (Cai et al. 2004) studied the difference between storm effects of beaches on tow sides of the tropical cyclone track. And in this paper, the landing time of typhoons with different tide types were discussed and analyzed.
The coast area in Zhejiang is dominated by muddy coastline. The scattered beach resources are particularly valuable and are also precious tourism resources, which has greatly promoted the development of local human society. While, typhoons that attack Zhejiang every year pose an increasing threat to the morphodynamic stability of the beaches. After being eroded, the topographic feature of the beaches become incomplete, which may pose a threat to the safety of tourists and reduce the disaster prevention and reduction capacity of the rear coastal area. Therefore, this study will help to deepen the understanding of typhoon impact on beach topographic, and provide an useful reference for beach protection and management by human society.
Conclusions
In this study, bathymetries at eight profiles of the Huangcheng Beach were measured pre- and post- Typhoon Lekima in 2019. Then numerical models of Delft3D Flow/Wave and XBeach were employed to investigate the morphodynamic responses when the typhoon encountered different tide types. On basis of the numerical results, it was concluded that more erosion would occur at top of the beach with more deposition at toe of the beach under middle tide and spring tide conditions. Because a higher water level and tide range could affect the sand at higher positions and move the sand offshore further. At the same time, stronger wave induced current would increase the sediment transport rate and reduce the deposition volume. The total amount of sediment involved in transportation had increased for the whole beach, leading to the reduction of net erosion volume. The net sand volume changes got smaller under the spring tide condition rather than middle tide and neap tide conditions. The study of this paper will help to understand the typhoon impact on beach topographic, and provide an useful reference for beach protection and management by human society.
Availability of data and materials
The first author, Dr. Xu Liu ([email protected]) can be contacted for access to the data.

